
Students and residents aspiring for a career in academic surgery are looking for training programs that will help jumpstart their careers by exposing them to mentorship and opportunities to conduct research. While the gold standard of academic productivity (for the time being) remains peer-reviewed publications, conference posters and presentations are an important secondary metric. In addition to feeding eventual papers, conference talks allow trainees to practice presentation skills, build their networks, and learn about the work being done at peer institutions and the field more broadly. Residents pursuing professional development are encouraged to apply to and attend conferences--though in the post-COVID era the cost of conference attendance and travel are being re-evaluated. For now, academic conference participation can serve as an important albeit limited metric to evaluate an overall institution's research power – especially as it relates to trainees.
The Academic Surgical Congress (ASC) is a joint surgical meeting co-hosted by the Association for Academic Surgery (AAS) and the Society for University Surgeons (SUS) and held annually in February. Anecdotally, it is a popular conference for students and residents to attend. The ASC maintains a public archive of all abstracts dating from 2015-2020. We obtained a machine readable version of this public database through the webmaster (this version of the data spans 2016 to 2023). Using number of accepted abstracts as a surrogate for research productivity, we wanted to identify successful institutions. Conceivably, by finding institutions who achieved high abstract numbers, we could conduct interviews and focus groups among key stakeholders at these programs to understand what they did, and how these actions can be replicated. We were particularly interested in seeing which programs demonstrated a high number of absolute accepted abstracts within the study period and also which programs were able to improve their abstract performance from year to year.
For each abstract, we looked at the year and primary institution at which the work was conducted. In the dataset, all of the institutional affiliations for each author are combined in one text string. To figure out the primary institution, we searched the institution block string for the first presence of "university", "hospital", "institute", or "medical center" or the first expression to occur before a comma. This method was chosen as institutions’ names are written variably (Department of Surgery, University Hospital, New York, NY vs. University Hospital, Division of Colorectal Surgery, Department of Surgery, New York, NY). Next, we found that for several abstracts belonging to the same institution in reality, the institution name was written in various ways (e.g. University of Alabama vs. University of Alabama - Birmingham or University of California - Los Angeles vs. David Geffen School of Medicine). We attempted fuzzy string matching as well as some manual corrections to improve this issue. While our efforts were not able to achieve perfect results, we were able to resolve a majority of the mismatches.
In order to do a primary survey of institutional trends in this dataset, we conducted the following analyses. First, we measured the number of abstracts accepted each year from 2016 to 2023. Second, we looked at the number of accepted abstracts by institution over the entire study period and identified the top twenty institutions. Then, we looked at the number of abstract institutions by year for each of these top twenty institutions to study changes in institutional trends over time. Finally, we did a subset analysis on post-COVID data (2021 to 2023) to look at absolute and per cent year-over-year changes in accepted abstracts to see which institutions were able to significantly increase their abstract performance in one year.
Accepted Abstracts are increasing but down from peak
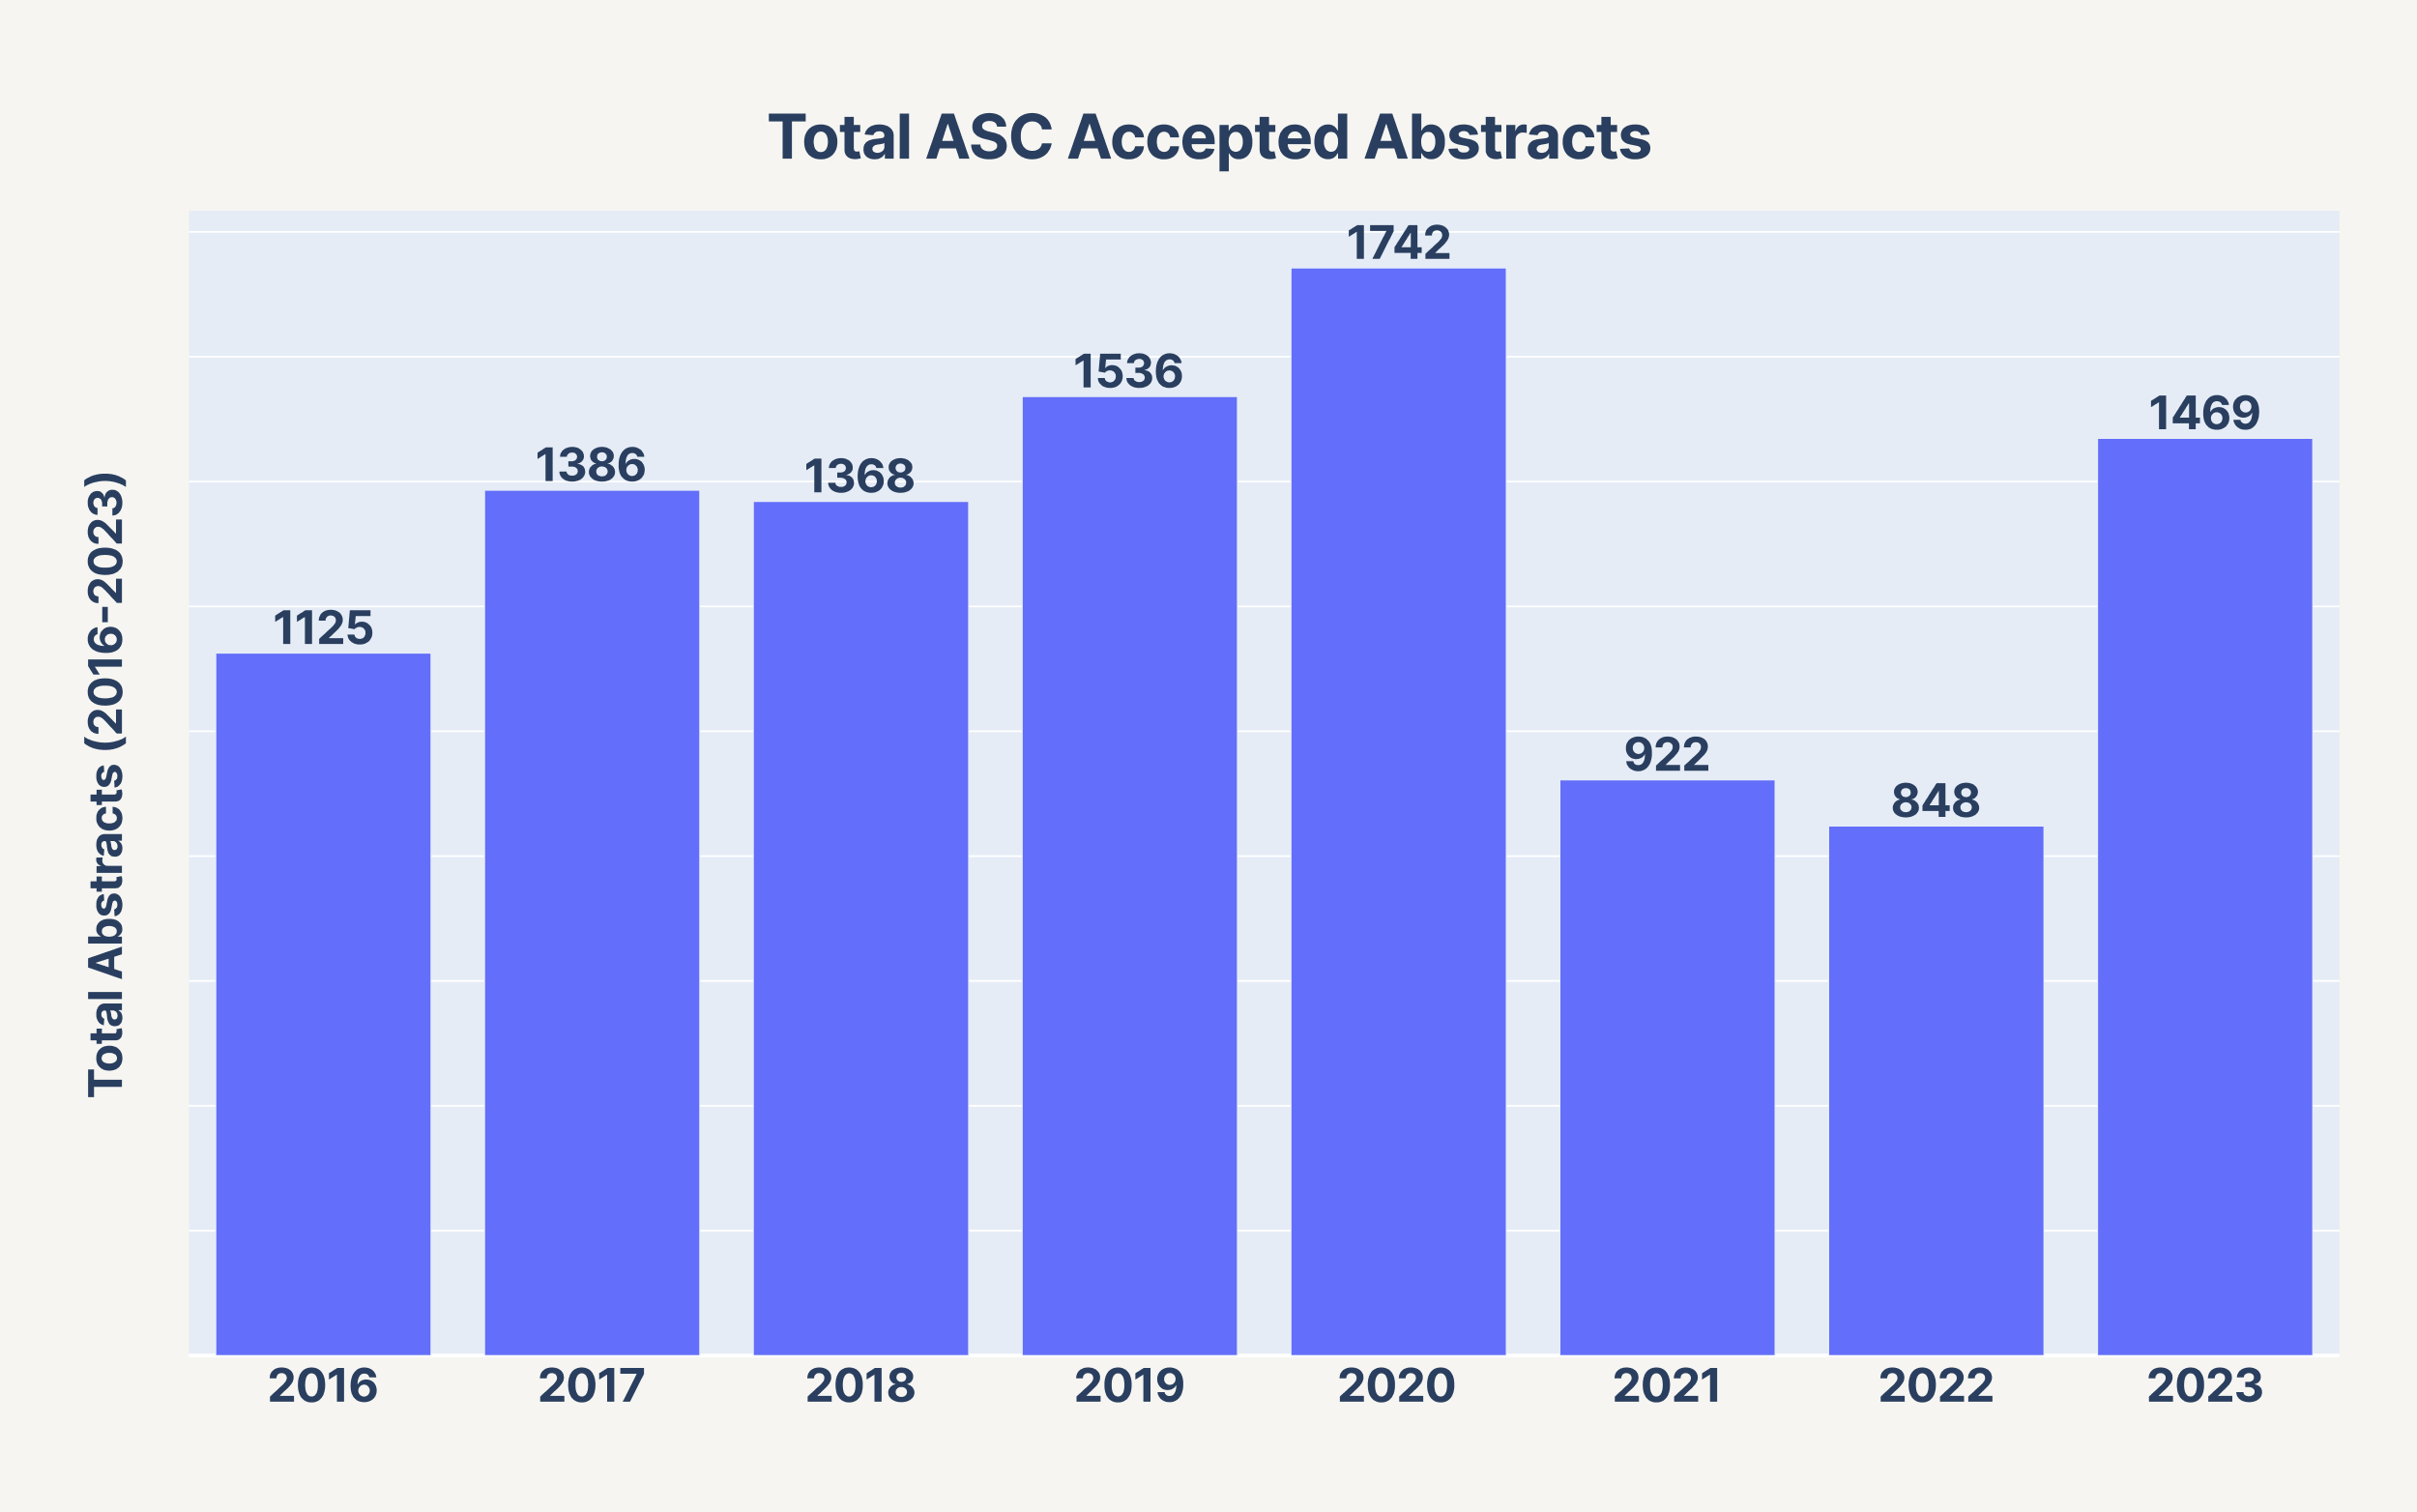
There were a total of 10,396 unique abstracts accepted at the Academic Surgical Congress between 2016 and 2023 for which complete institutional data is available.
We plotted the total number of abstracts accepted by year. The number of accepted abstracts increased from 1125 in 2016 to an all-time high of 1742 in 2020 before declining to 922 and 848 in 2021 and 2022, respectively. Accepted abstracts have since rebounded to 1469 in 2023, or roughly 84% of the maximum amount. Of note, the 2021 and 2022 meetings were held virtually due to the COVID-19 pandemic. Conversely the 2020 meeting was held immediately prior to the institution of lockdowns and other social distancing policies.
Alabama, Michigan lead abstract acceptances during study period
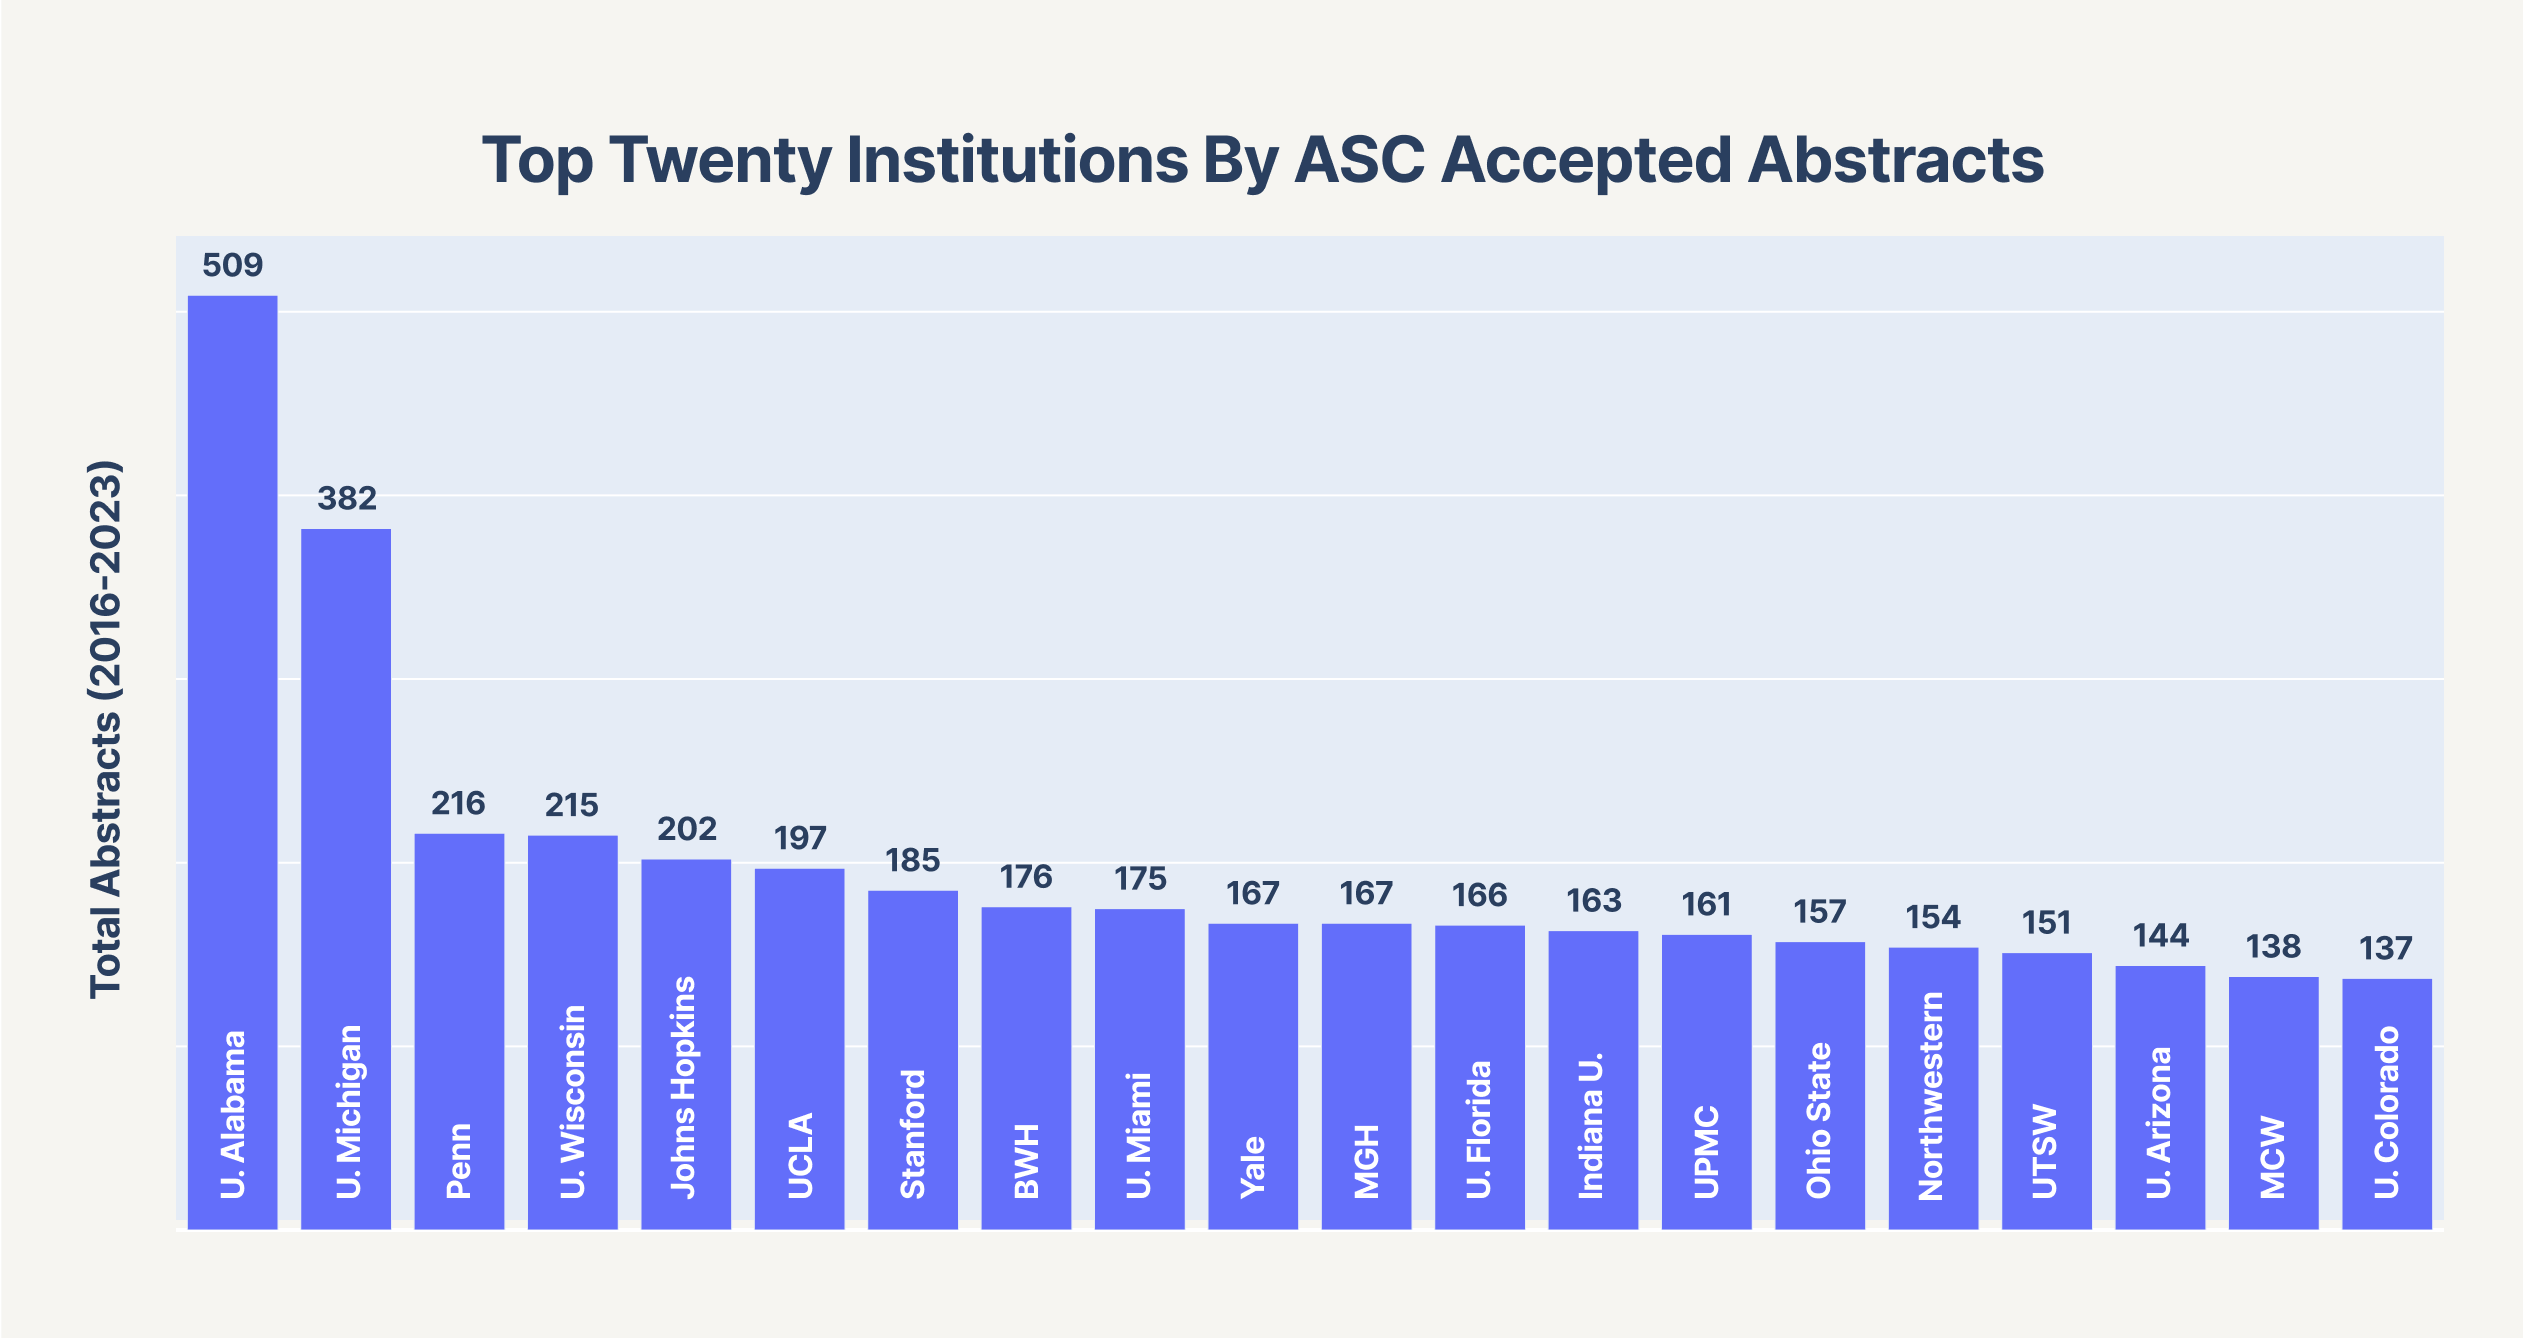
Next, we plotted the total number of accepted abstracts by institution. The graph shows data for the twenty leading institutions. The University of Alabama and the University of Michigan lead in abstract acceptances during the study period (509 and 382, respectively). Given an eight year time-range, the top twenty institutions reflect an average annual abstract acceptance ranging from roughly seventeen to 63.
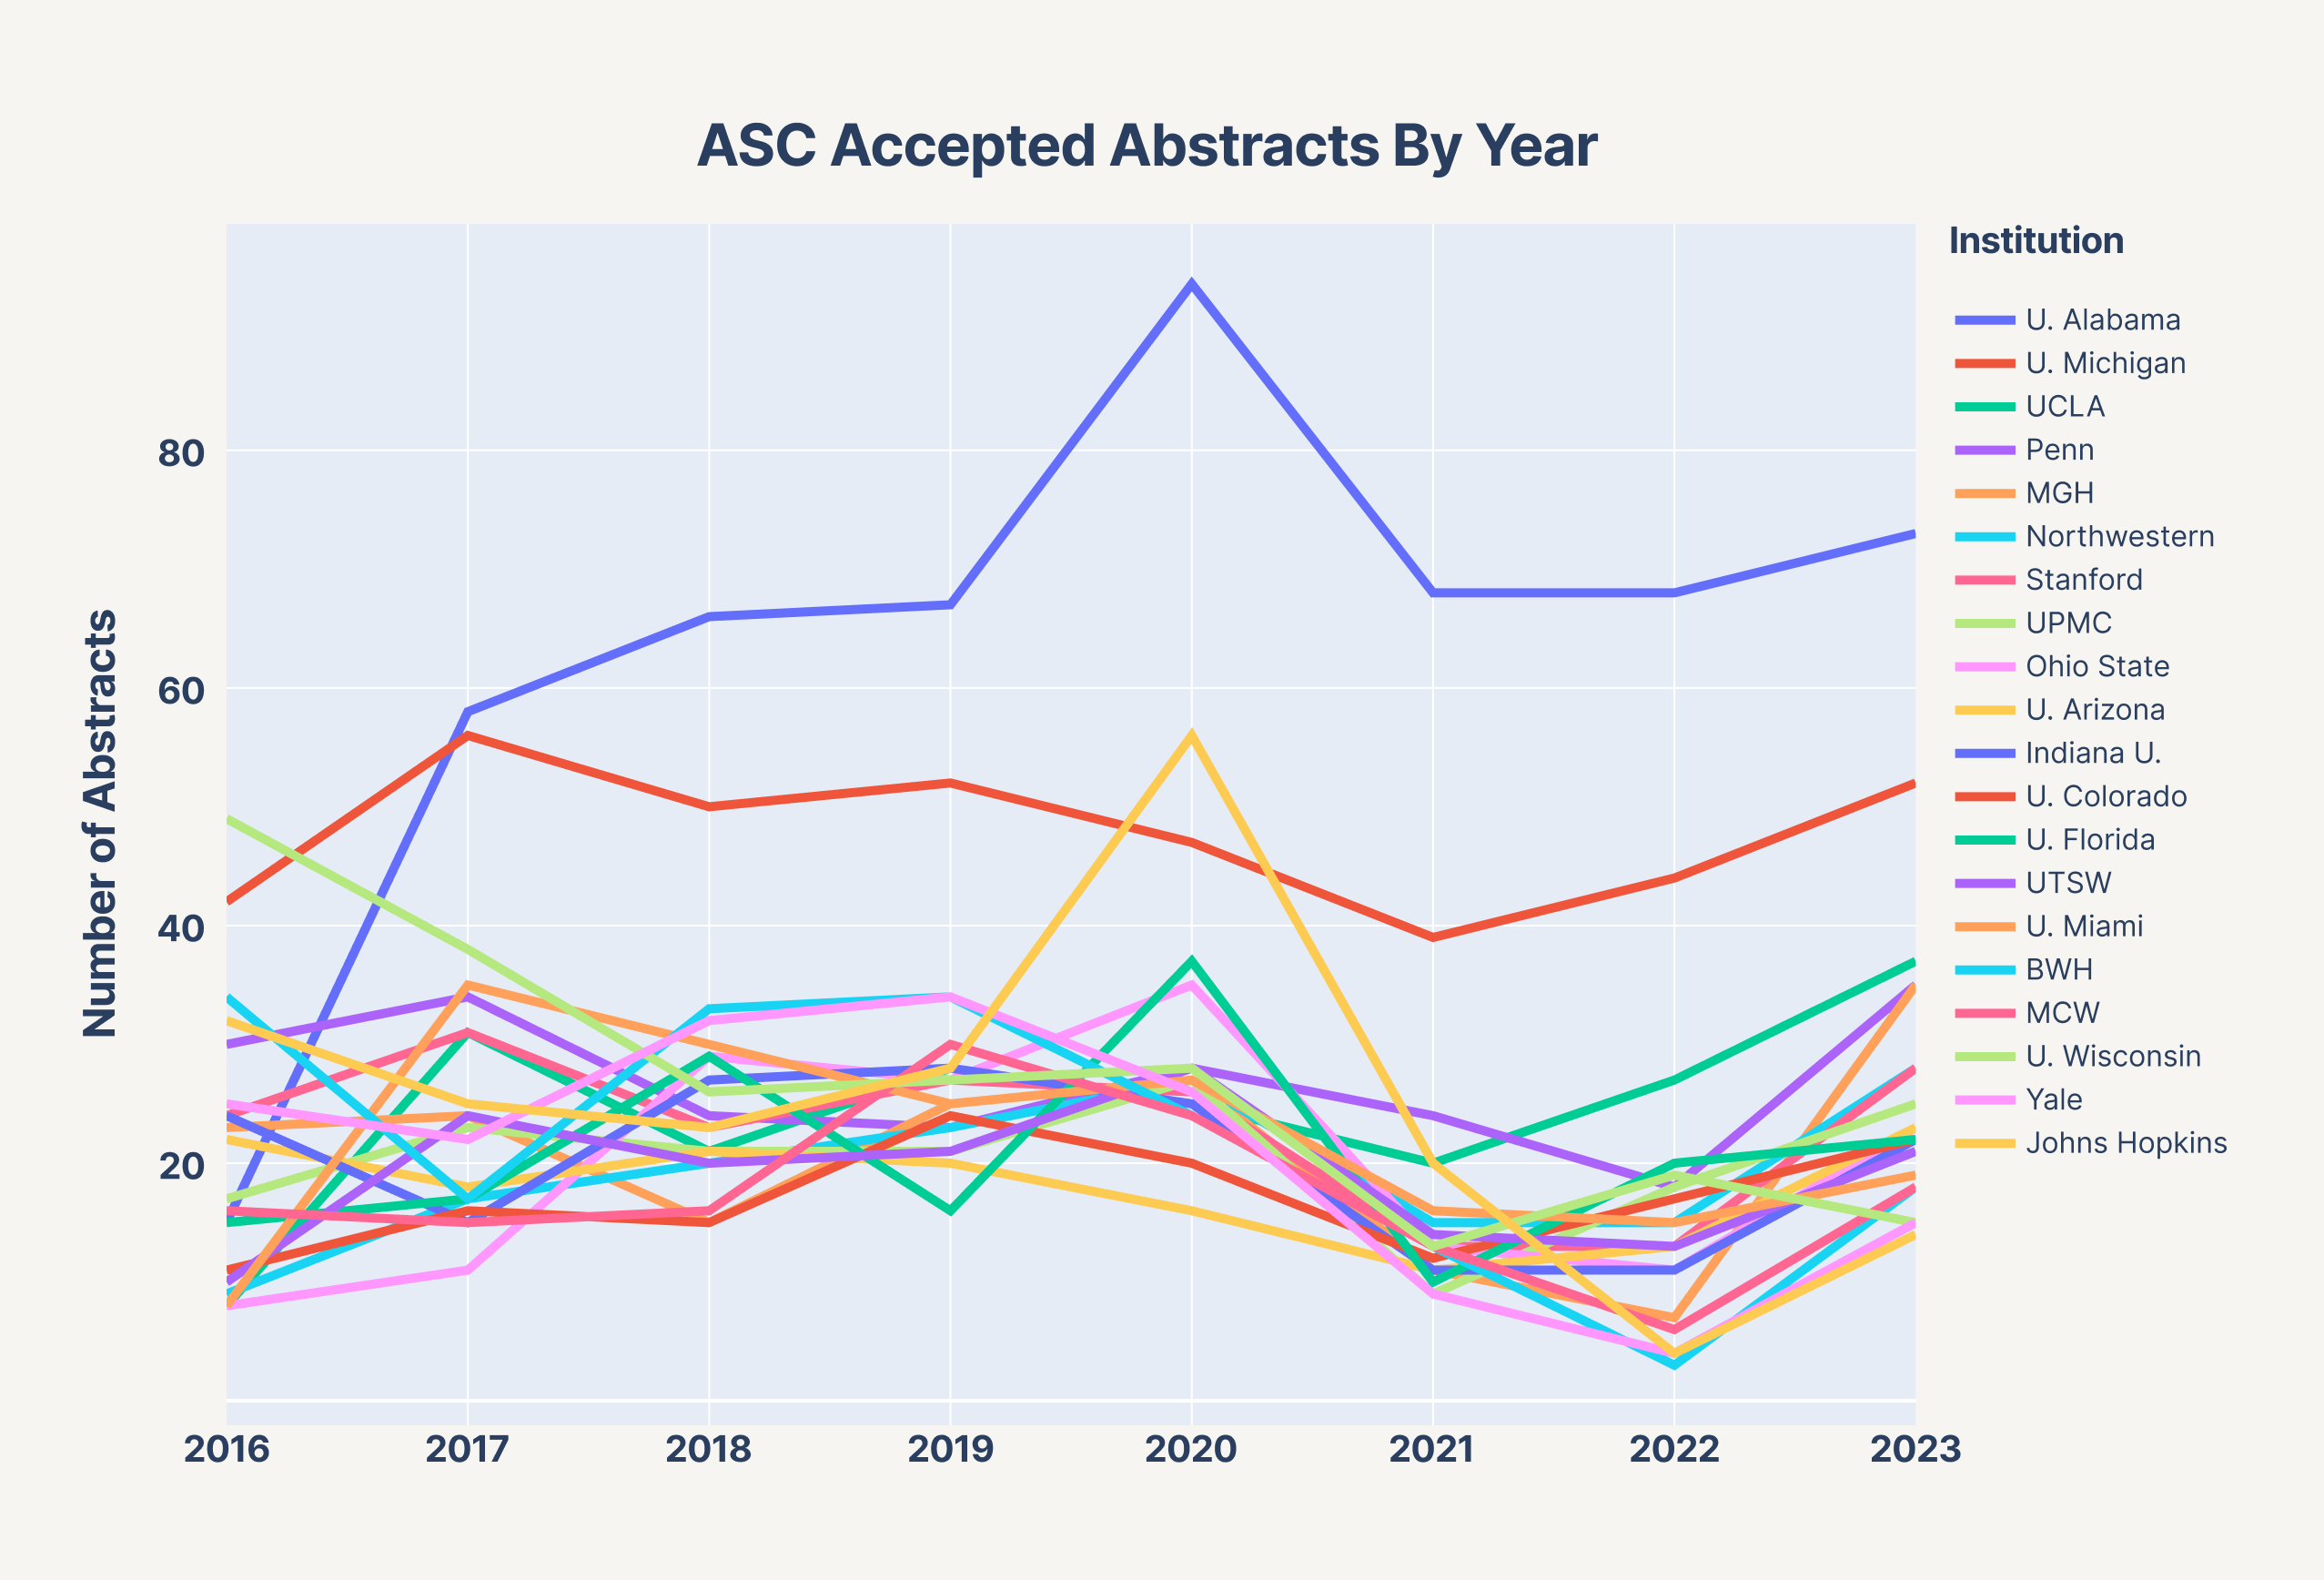
We also plotted the number of accepted abstracts by year using a separate line plot for each institution. The University of Alabama surged from 15 to 58 abstracts from 2016 and 2017, maintaining over 60 abstracts per year thereafter. The University of Michigan maintained between 30 and 60 abstracts for each year and has ranked in the top three for each year studied. Overall, there appears to be a general clustering of the remaining institutions.
Of note, there is a noticeable dip from 2020 to 2022 seen at most institutions which starts to recover in 2023, consistent with the aggregated data shown in the previous figure.
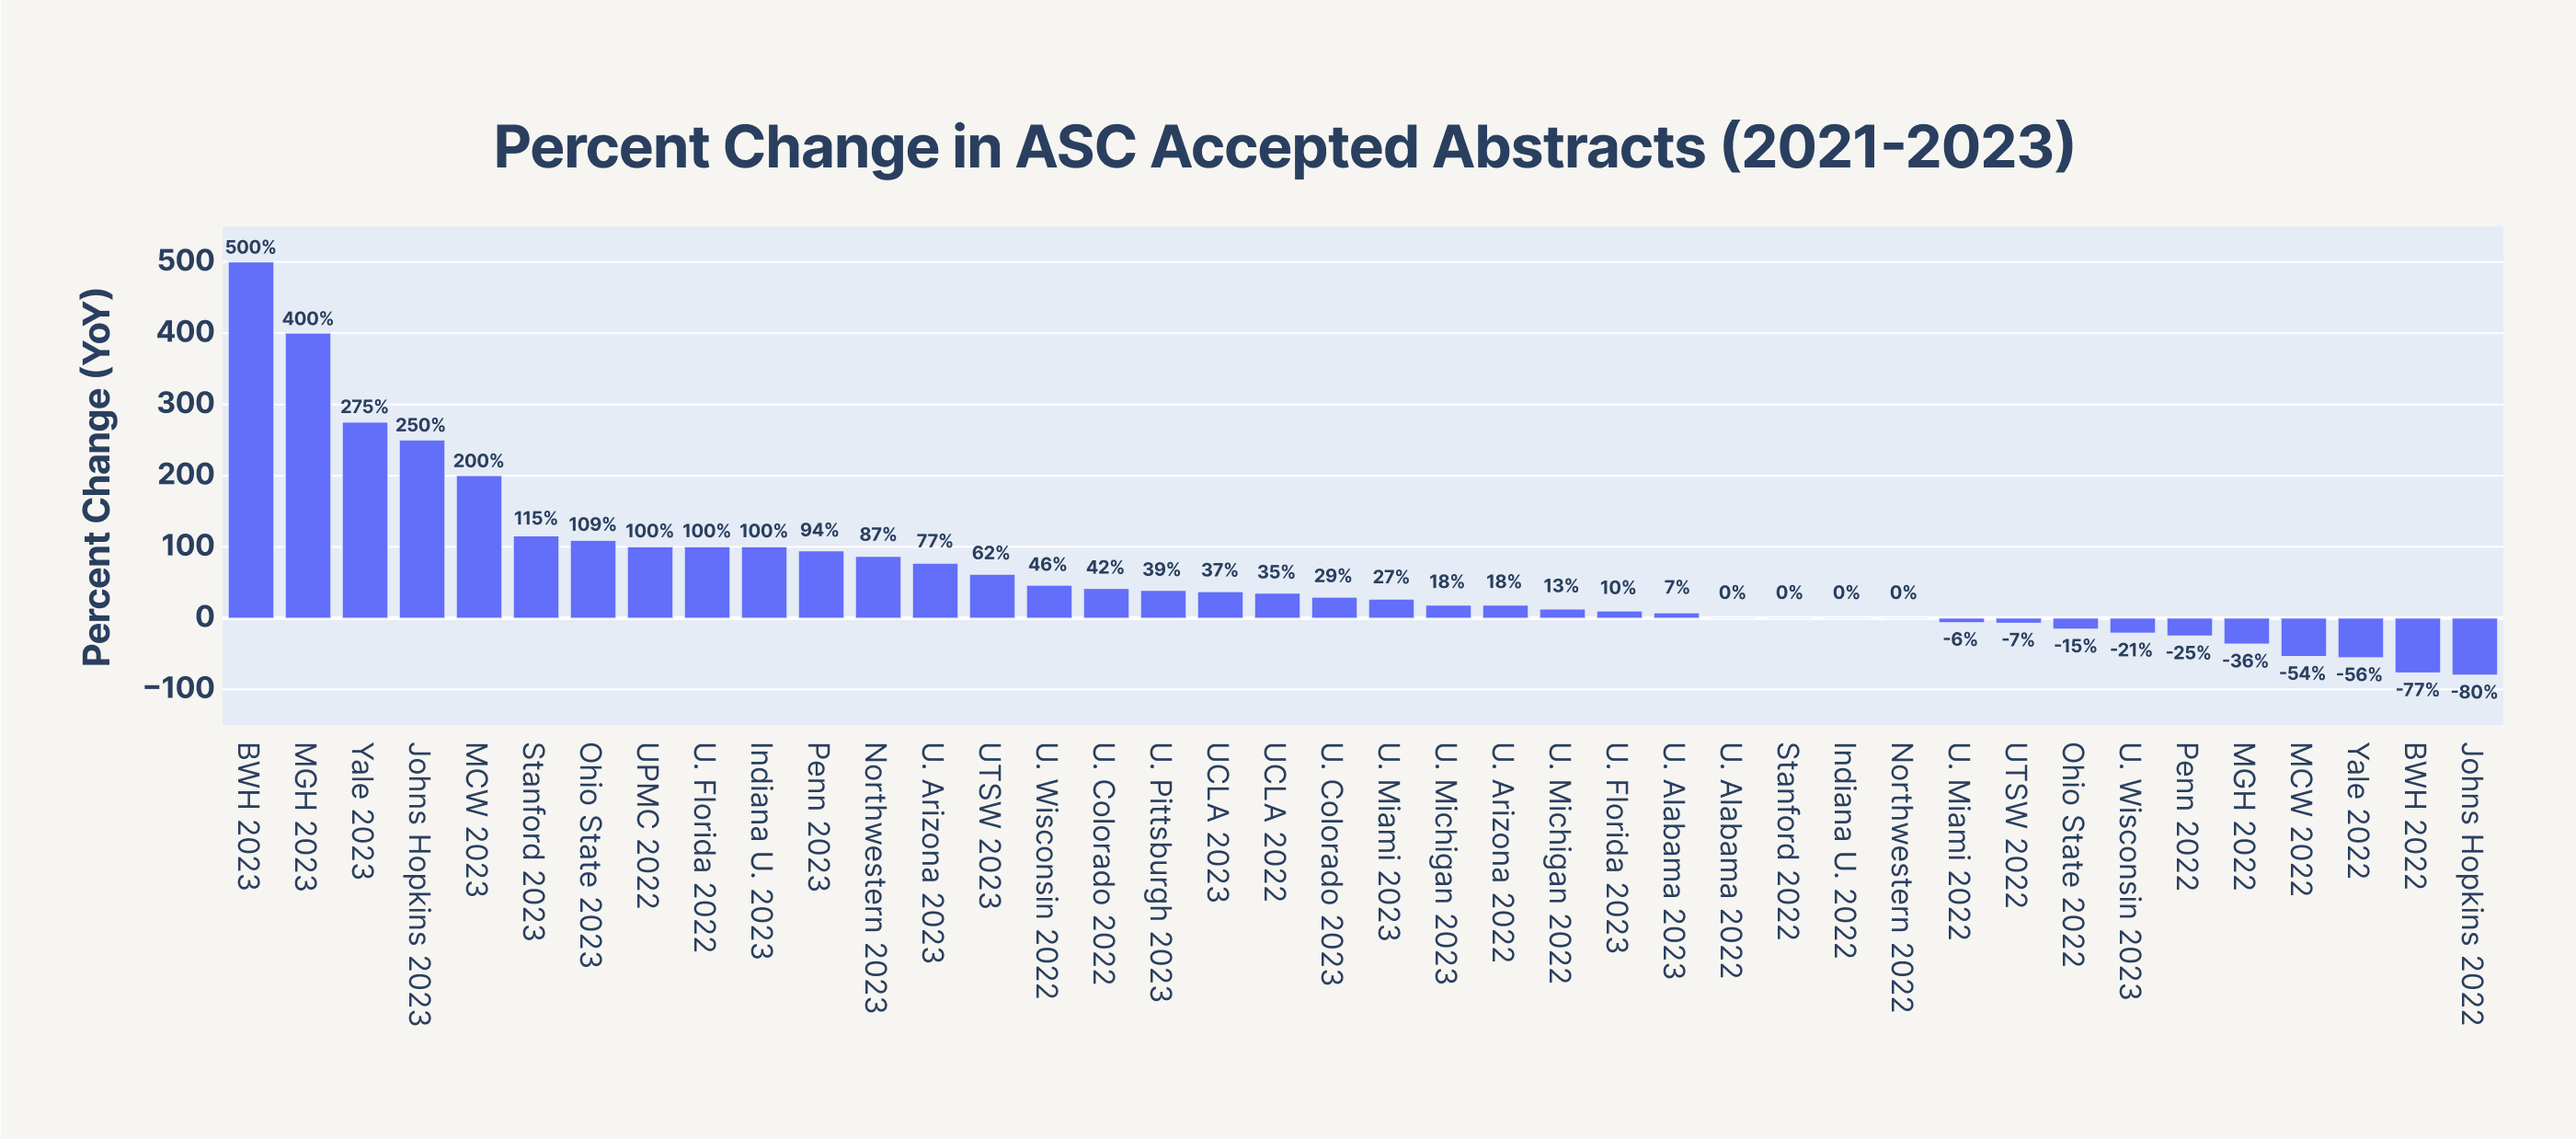
MGH, Brigham lead absolute and per cent increase in abstracts in 2023
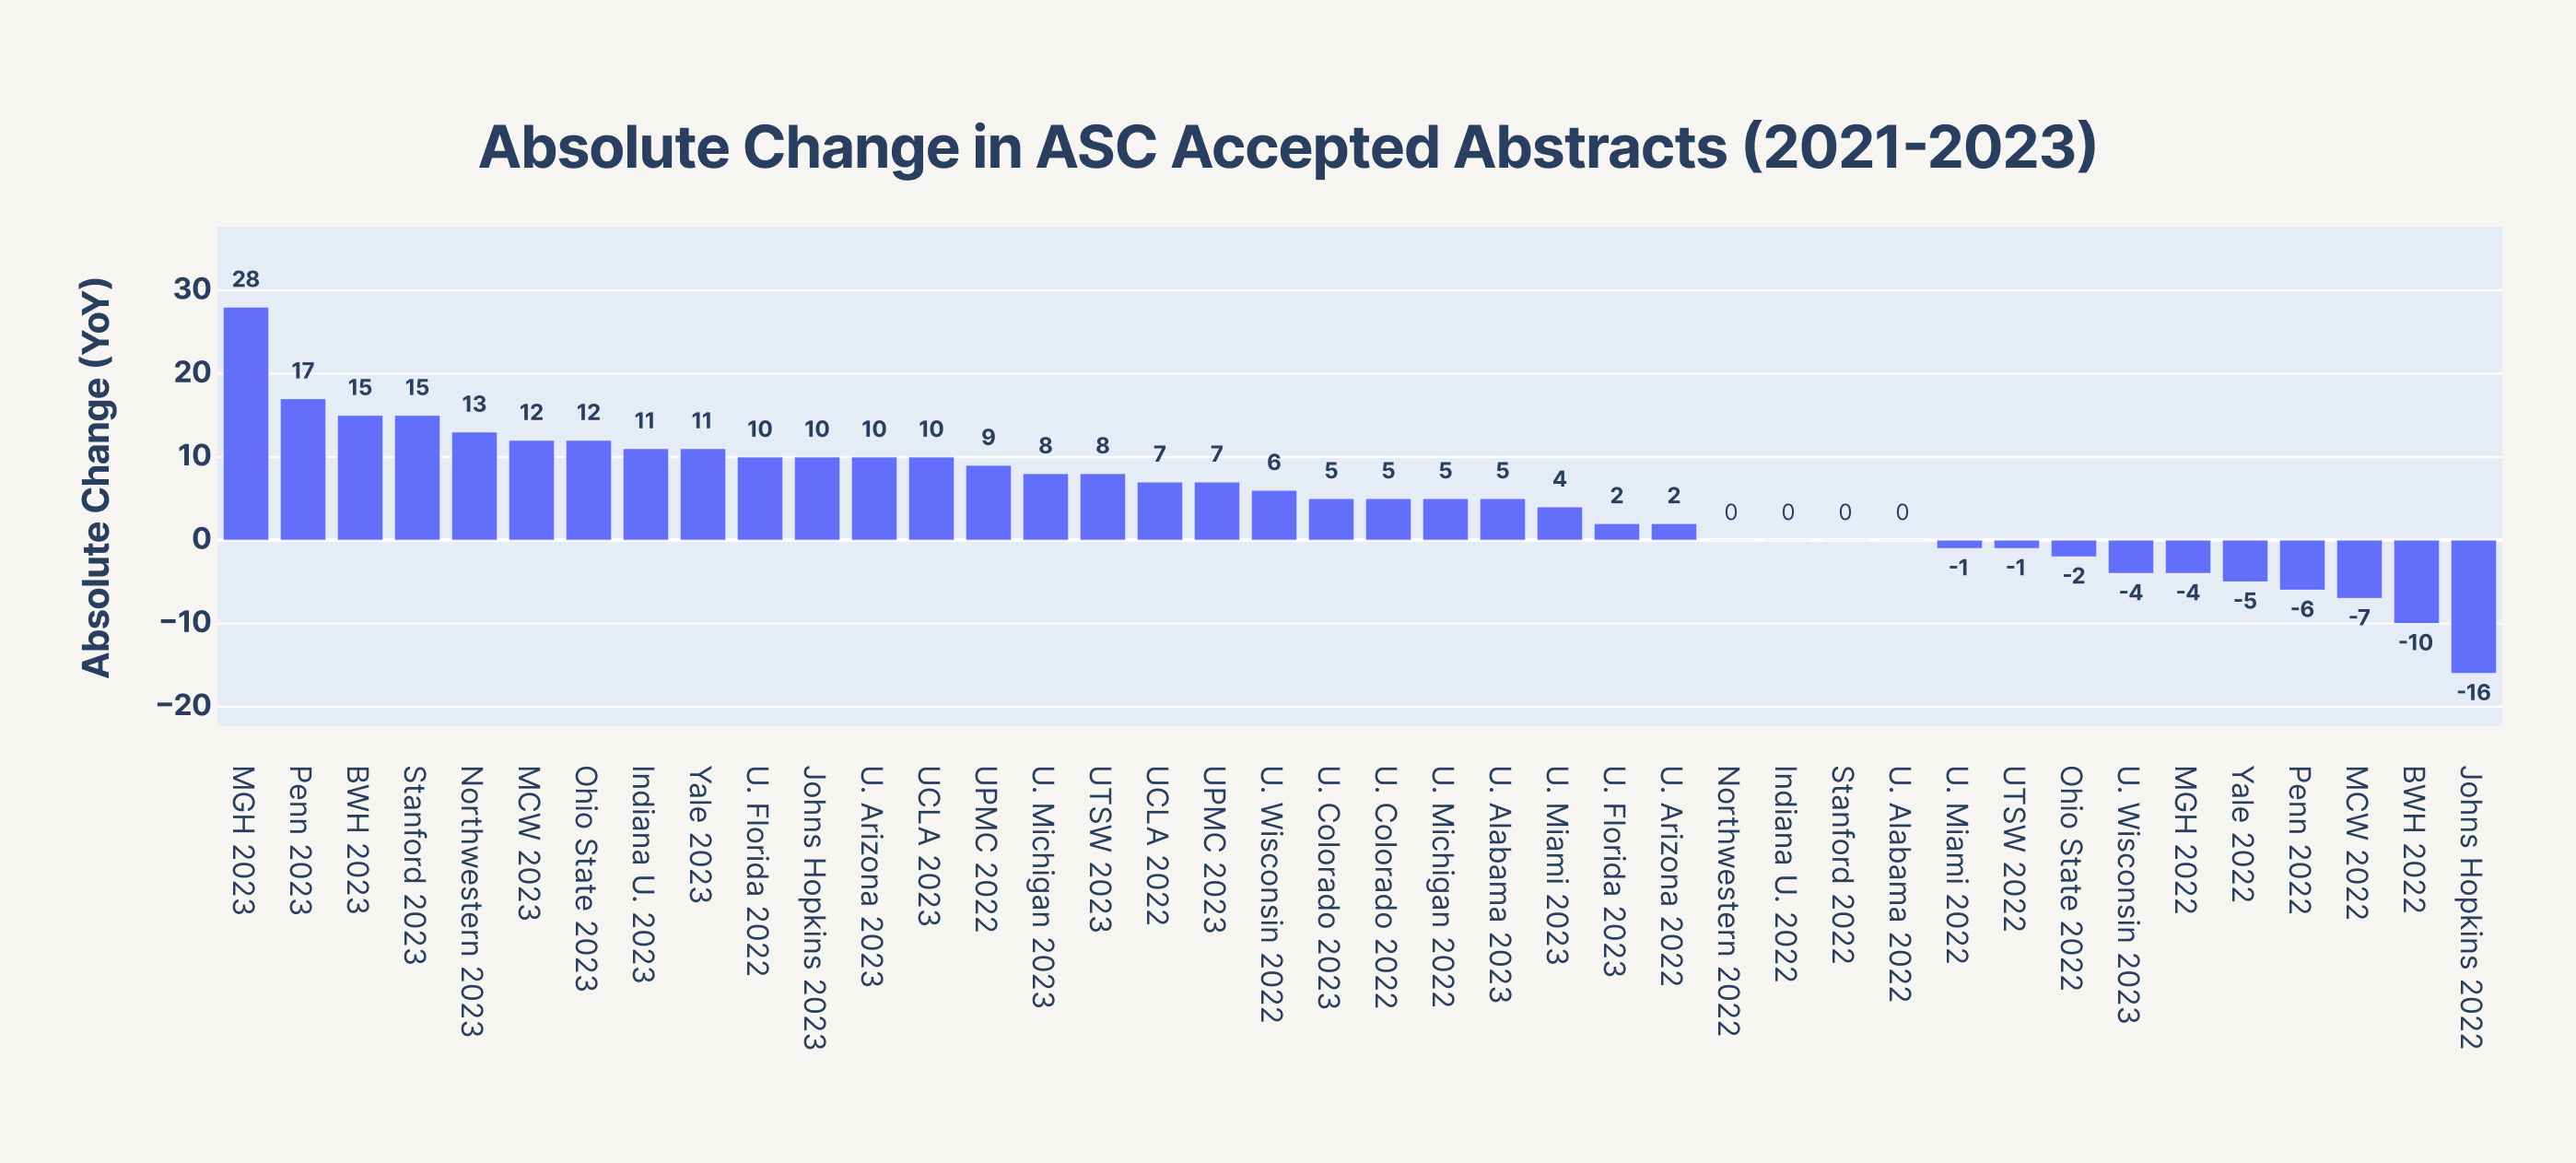
Next, we measured the absolute and percent change between accepted abstracts in consecutive years for the top twenty institutions. We restricted our analysis to 2021, 2022, and 2023. The greatest absolute increases in accepted abstracts came from Massachusetts General Hospital in 2023 (28), The University of Pennsylvania (17), and Brigham and Women's Hospital (15), all in 2023. The greatest percentage increases in accepted abstracts came from Brigham and Women's Hospital (500%), Massachusetts General Hospital (400%), and Yale Univeristy (275%), also all in 2023. Interestingly, University of Alabama (+0 in 2022, +5 in 2023) and University of Michigan (+5 in 2022, +8 in 2023) - which rank at the top in all time and yearly abstracts - experienced less extreme swings during the 2021-2023 time period. The greatest year-over-year increase in the study period was University of Alabama's increase of 43 abstracts in 2017, but as it falls outside the time range of this subset analysis, that data is not shown here.
Conclusions
In this data exploration, we analyzed abstract acceptance data for the Academic Surgical Congress between 2016 and 2023. We showed that the number of abstracts increased from 2016 to 2020, dipped in 2021 and 2022, and is recovering in 2023 - likely reflecting the variability forced by COVID19 and the transition to virtual conferences in 2021 and 2022. We also showed that the University of Alabama and the University of Michigan have significantly led accepted abstracts throughout the study period with University of Alabama maintaining a top position following an impressive 287% percent increase in abstracts between 2016 and 2017. In 2023, Massachusetts General Hospital and Brigham and Women's Hospital rank in the top three for both absolute and percent changes in year-over-year abstract acceptances in 2023.
Limitations and Future Directions
This data exploration has several limitations. First, our study is limited to one conference, and conferences themselves are only a limited component of academic productivity. However, the Academic Surgical Congress is an international meeting that is well regarded, popular among trainees, and has consistent multi-year data. We can improve the generalizability of our findings by bringing in similar data from other large meetings – such as the American College of Surgeons Clinical Congress and the Society of American Gastrointestinal and Endoscopic Surgeons (SAGES). We can also use the PubMed API to perform similar analyses in top surgical journals such as JAMA Surgery or the Annals of Surgery.
Furthermore, there is renewed concern that the ever-increasing number of abstracts and papers required for trainees to progress academically is leading to an unhealthy "research treadmill". While these concerns are valid, research productivity remains an important component of academic development, and number of abstract acceptances can serve as a meaningful metric in guaging an institution's research productivity and culture.
Another limitation of our study is our assumption that the first institution listed in the author block is the primary institution–a method which does not take into account multi-institutional abstracts. However, we suspect this reflects the minority of the abstracts. Finally, we have not fully optimized name-matching to correctly combine terms like "University of Alabama" and "University of Alabama Birmingham". One future direction to improve this analysis would be to optimize the fuzzy string matching algorithm used in our code. Alternatively, more granular source data could also help improve the accuracy of our findings.
With regards to the data we have obtained, we can conduct survey-based studies or focus groups with key stakeholders from institutions that have demonstrated strong abstract performance during the study period as well as those who have shown significant improvement. By talking to department chairs, program directors, and research and education leaders we can understand what steps each institution took to improve abstract acceptance (e.g. hiring a new research faculty, creating a mentorship program, providing administrative support for IRBs/stats etc.). Following this, we can map individual interventions to improvements to understand the contribution that each can have on increased academic productivity.
We have also not yet mined the abstract text itself for themes. Using natural language processing, we can understand how themes and trends of emergent research change from year to year, and even develop models to predict which topics will be of interest in future works. This will likely be the subject of a future data exploration.
Overall, we hope to demonstrate that abstract acceptance data from a single international meeting can provide interesting, meaningful data on which programs have strong research infrastructure and which programs are making strides to achieve it. By studying this data and improving the inputs, we can better understand whose example to follow and ultimately develop a playbook that all institutions can employ to maximize the academic opportunities of students and trainees.
See the Data
You can see the raw data as well as all of our code here, and use this for your own studies with appropriate attribution.
Acknowledgements
Special thanks to Ojas Sathe for assistance with the fuzzy string matching